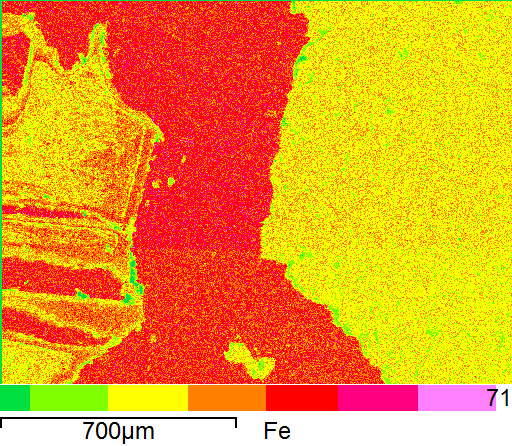
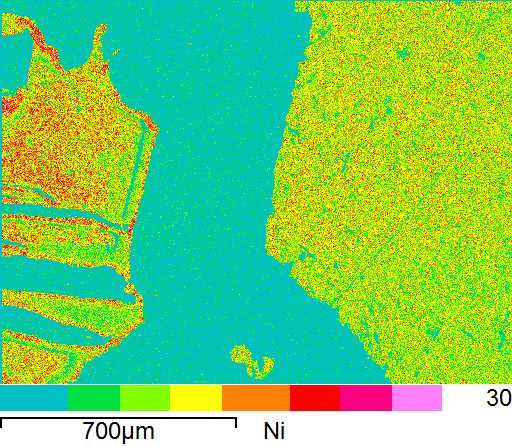
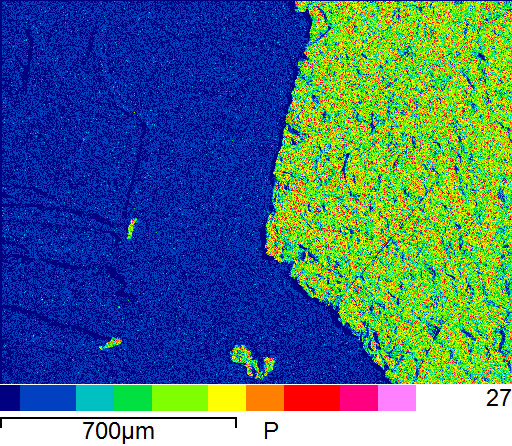
Elemental mapping uses the EDS to determine the elemental content of each pixel in a field of view. A false color map is made for each element, showing the relative abundance of the element across the field of view. Blue is the lowest abundance and red / pink represents the highest abundance.
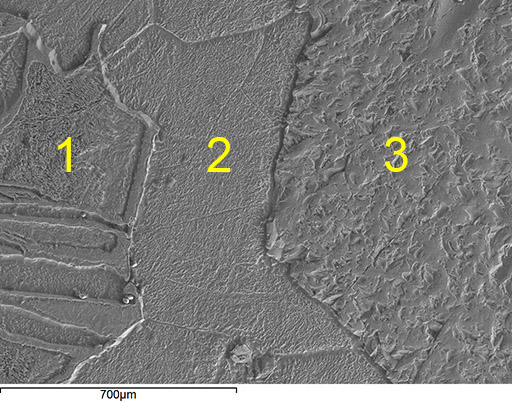
This sample is a fragment of an Esquel Palasite — a stony iron meteorite. This field of view contains three main areas of distinct minerals, with differing ratios of iron (Fe), nickel (Ni) and phosphorus (P). This is an interesting sample as these minerals rarely if ever occur naturally on earth.
A standard SEM image showing the surface texture of the sample. Region 1 is taenite (FeNi), region 2 is kamacite (Fe0.9Ni0.1), and region 3 is schreibersite (Fe,Ni)3P.Iron (Fe) map: Note the red section in the middle, corresponding to the kamacite that is 90% iron. On either side are yellow regions, approximately 50% iron. Nickel (Ni) map: Note the blue/green kamacite region in the middle which is 10% nickel. On the left the yellow-red region is taenite (50% nickel) and the mostly yellow region on the right is schreibersite which is 25% nickel. Phosphorous (P) map: Phosphorous composes 25% of the schreibersite region on the right. Note three small isolated sections of phosphorous which are small inclusions of schreibersite in the kamacite mentioned above. The smallest two of these inclusions are not readily visible in the standard SEM image but stand out clearly with elemental mapping.