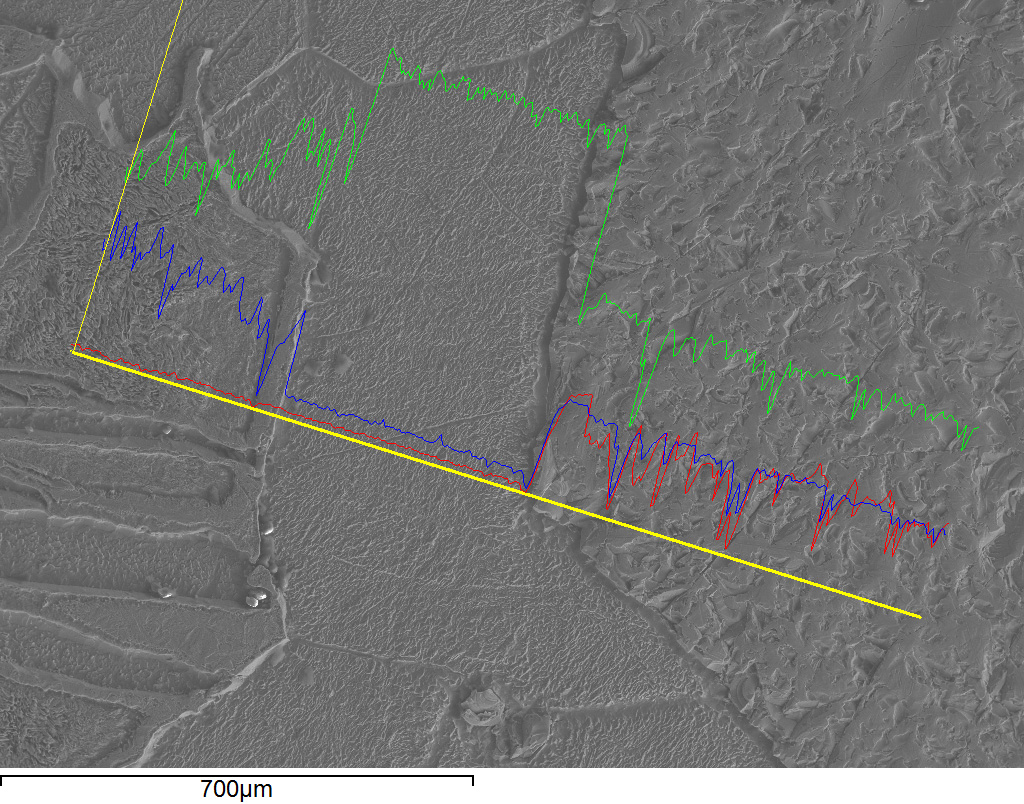
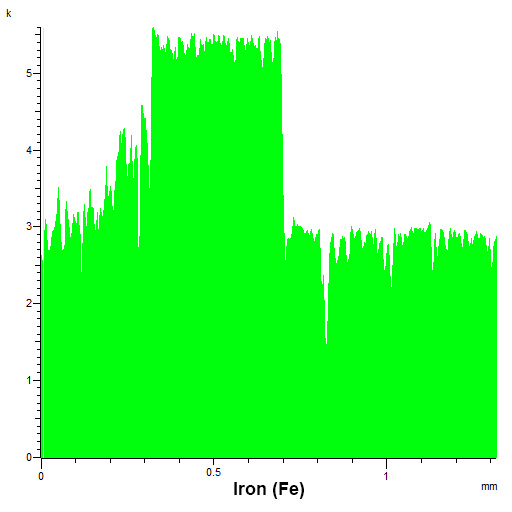
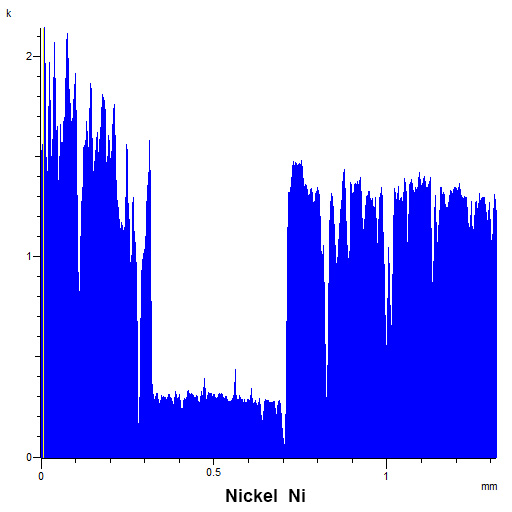
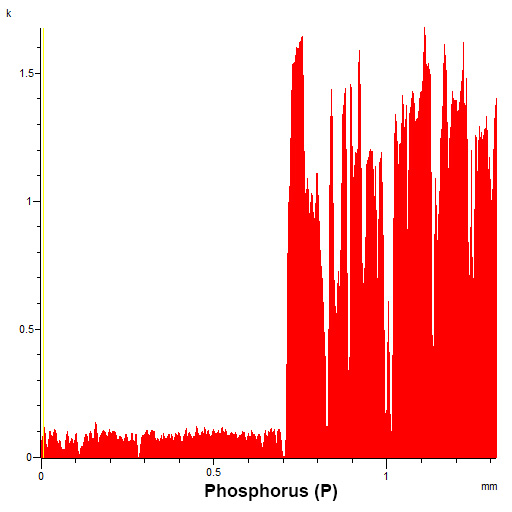
An elemental linescan is made by having the EDS measure the elemental composition of each pixel along a user defined line across the sample. Graphs of relative abundance of selected elements are shown.
This sample is a fragment of an Esquel Palasite — a stony iron meteorite. The same sample is shown on the Elemental Mapping page. This sample is mainly composed of iron (Fe), nickel (Ni) and phosphorus (P) therefore linescans are shown for these three elements.
Standard SEM image showing the surface texture of the sample: The thick yellow line is the line that was scanned. Above this are superimposed three graphs, showing the varying amounts of iron Fe (green), nickel Ni (blue), and phosphorus P (red). The left ¼ of the line that was scanned is taenite (FeNi). The next section to the right is kamacite (Fe0.9Ni0.1). The rightmost half of the line is schreibersite (Fe,Ni)3,P which in the sample is Fe2NiP.Iron (Fe) linescan. Note how the iron reading trends upward in the taenite region on the left, whereas the transition from kamacite region in the middle to the schreibersite region on the right is very abrupt.Nickel (Ni) linescan. Note how the nickel reading trends downward in the taenite region on the left, whereas the transition from kamacite region in the middle to the schreibersite region on the right is very abrupt.Phosphorus (P) linescan. Note the abrupt transition of the phosphorus readings from the taenite and kamacite regions on the left to the schreibersite region on the right. The "dropouts" in the graph are due to surface roughness blocking some X-rays from travelling from the sample surface to the EDS detector.